Segment Market Screener
MLB The Show 26 Market Segments
Use this page to explore MLB The Show 26 card prices by market segment. Compare buy and sell prices, spread, 24-hour movement, and activity levels across Live Series, Legends & Flashbacks, Golds, Silvers, Bronzes, and other key market groups.
Browse prices by market segment
Choose a segment to view all tracked cards in that market bucket. Then sort the table to compare prices, spread, movement, activity, and row-level sparklines.
Value The Show Pack
1,087
+11.8%
653 / 418
24h +2.7% 7d +1.1%
Value The Show Pack Price Index
Track how this market segment has moved over time.
Value The Show Pack
1,087 tracked cards
Card | Pressure | Buy | Sell | 24h | 7d % | 30d % | 30d Chart | Volume | Where to Get | Changed |
|---|---|---|---|---|---|---|---|---|---|---|
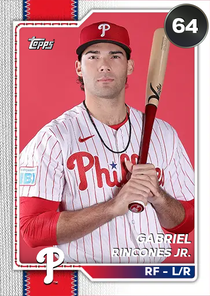 Gabriel Rincones Jr. Phillies Live | Mixed Net flow -1/hr |  22 22 | 5 | +9.5 | +136.6% | +340.9% | 3 | 17 minutes ago | ||
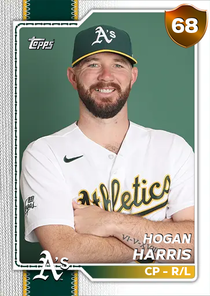 Hogan Harris Athletics Live | Mixed Net flow +6/hr | 108 | 25 | +9.5 | +104.7% | +167.9% | 7 | 13 minutes ago | ||
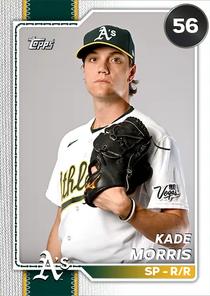 Kade Morris Athletics Live | Buy pressure +10 net buys/hr | 105 | 5 | +9.5 | +37.8% | +66.7% | 12 | 1 minute ago | ||
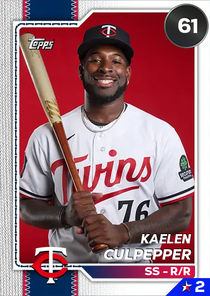 Kaelen Culpepper Twins Live | Mixed Net flow +7/hr | 188 | 25 | +9.5 | +69.3% | +610.9% | 9 | 1 minute ago | ||
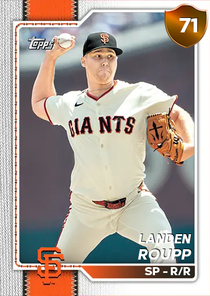 Landen Roupp Giants Live | Buy pressure +18 net buys/hr | 110 | 25 | +9.5 | +51.3% | +50.3% | 18 | 11 minutes ago | ||
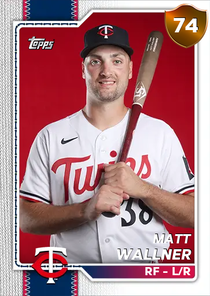 Matt Wallner Twins Live | Buy pressure +13 net buys/hr | 152 | 25 | +9.5 | +93.0% | +224.7% | 13 | 3 minutes ago | ||
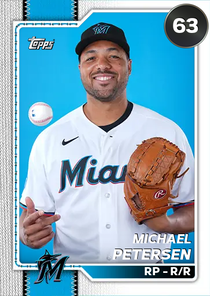 Michael Petersen Marlins Live | Buy pressure +9 net buys/hr | 181 | 100 | +9.5 | +31.0% | -12.8% | 9 | 11 minutes ago | ||
 Mickey Moniak Rockies Live | Mixed Net flow +7/hr | 193 | 125 | +9.5 | -12.7% | -73.7% | 7 | 1 minute ago | ||
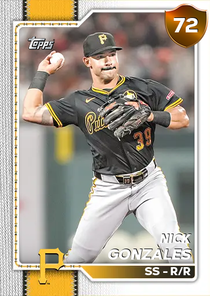 Nick Gonzales Pirates Live | Mixed Net flow +5/hr | 225 | 125 | +9.5 | +16.3% | -22.5% | 5 | 5 minutes ago | ||
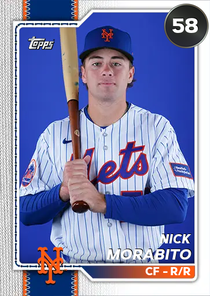 Nick Morabito Mets Live | Mixed Net flow -2/hr | 15 | 5 | +9.5 | +94.1% | +251.1% | 4 | 3 minutes ago |
How to use this market segments page
This page is built for deeper market exploration than the main Market dashboard.
Instead of only showing top movers and high-level segment summaries, it lets you compare the market at both the segment level and the individual card level.
Use the segment controls above the table to switch between Live Series, Legends & Flashbacks, the new All view, tier-based live cards, and other market groups. Then sort the table to compare current buy and sell prices, spread size, 24-hour movement, recent activity, and inline row-level sparklines.
If you want a broad overview of what the market is doing right now, start on the Market page. If you want to inspect a specific slice of the market in detail, use this page.